|
|
THE STRUCTURAL PROFILE
by
C. Wesley Dupertuis, Ph. D.
Professor Emeritus of Clinical Anthropology School of Medicine, Case Western Reserve University
Cleveland, Ohio
and
Helen S. Dupertuis, M. A. Assistant Professor Emeritus of Clinical Anthropology School of Medicine, Case Western Reserve University Cleveland, Ohio
Copyright Lucy Dupertuis and William Dupertuis
ABSTRACT: An objective method for describing variation in human physique is presented. The technique is based on anthropometric measurements taken at skeletal landmarks on all major areas of the body and then calculated as ratios to stature. For a visual presentation of the data the percent variation of these ratios from average values is plotted on a graph. The line formed by connecting the average of the two plots for each of the five areas - head, arms, upper trunk, lower trunk, and legs depicts the Structural Profile for an individual or the average for a group.
Various applications of the Structural Profile for individuals - racial, athletic and extreme somatotype groups - are presented and discussed. Results indicate that the Structural Profile may be regarded as a morphological fingerprint - unique for the individual and distinctive for groups of similar subjects. Being based on skeletal measurements the Structural Profile remains remarkably constant throughout life. The Structural Profile provides a concise visual assessment of physical form and its intersegmental relationships. It is a simple, inexpensive procedure, and completely objective.
In our many years of research on the constitutional characteristics of man, one of our chief concerns has been the relationship between form and function, between physical endowment and performance. During these investigations we have constantly sought methods for describing body structure which would be meaningful, objective, and readily correlated with other measureable and observable aspects of human personality.
Over the centuries there have been many attempts to develop systems for describing variation in human physique. By far the best and most successful of these has been the somatotyping technique devised by Dr. William H. Sheldon ( '40, '54 ). Since 1938, somatotyping has formed the basic framework for most of our investigations in human constitution. In searching for constants which would provide a higher degree of objectivity in the somatotyping technique, we began to experiment with anthropometry.
During the late 1950's, Sheldon and his coworkers developed the Trunk Index -- the mathematical relationship of upper to lower trunk area based on planimeter measurements taken on somatotype photographs. Results indicated that the trunk index appeared to remain constant throughout life. This was an important advance in objectification, but we still felt the need for additional constants which would apply to other parts of the body as well. It was from our search for stable and measureable aspects of the physique that the Structural Profile evolved.
Of all of the determinants of physique, it seemed to us that the skeleton offered the most promising, basis for the constants we sought. The skeleton is the most stable aspect of the body, the chief determinant of bodily proportions, least affected (in adults) by nutritional status, and least subject to visible and measureable change. In the early 1960's we began experimenting with anthropometric measurements which would describe the size and shape of the bony framework of the body and be readily reproducible by technically trained personnel.
Eventually we narrowed the choice of measurements down to eleven plus height and weight. Each of the five major areas of the body (head, arms, upper trunk, lower trunk and legs) was represented in the series by two breadth measurements. Only one skeletal measurement, chest depth, was found to describe the antero-posterior aspect of the trunk. Each of the measurements was then related to the stature of the individual and the ratios obtained were plotted in graphic form against a selected set of norms, evolving finally into what we call a Structural Profile.
The measurements and the corresponding measurement/stature ratios are based on objective techniques, are readily reproducible, and lend themselves to many forms of statistical analysis. The resulting pattern of the Structural Profile formed by the plotted ratios provides a frame of reference for relating body structure to other aspects of total personality.
We do not consider the Profile a substitute for somatotyping but simply an additional method for describing physical structure, based on skeletal measurements alone. While as an objective tool it has proved very illuminating and helpful to use in conjunction with somatotyping it can also be used quite independently. It has been particularly valuable, for instance, when it was impossible to obt tain somatotype photographs. Just as the paleontologist reconstructs the form and type of a body from skeletal remains, so from our Structural Profile we can gain information about bodily proportions, musculature, and to some extent, organ size. Whenever possible, however, we take both measurements and photographs because we have found their co-relationship invaluable.
To date, we have applied the Structural Profile technique to studies of various clinic populations (particularly patients with coronary heart disease) to studies of the growth and development of children; to the comparison of physical assessment of athletes, racial groups, business personnel, and university and medical students - all with interesting results.
METHODS
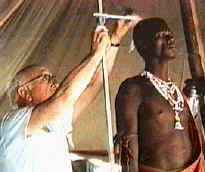
To prepare a Structural Profile of an individual ( or a group ) we employ the following eleven basic measurements plus height and weight, using the metric scale and recording in millimeters. In each instance we apply sufficient pressure to compress the flesh in order to get as close to bone as possible without causing undue pain to the subject. Whenever possible subjects are measured in the nude or wearing brief underclothing. The four measurements on the extremities ( elbow., wrist, knee, and ankle ) are routinely taken on the left side. In the calculations each limb measurement is doubled to represent both sides of the body. All measurements reported upon in this paper were taken by C. W and H. S. Dupertuis.
Measurements for the Structural Profile
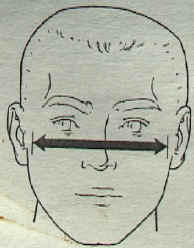
1. FACE- Bizygomatic diameter. The maximum horizontal breadth of the face across the zygomatic arches. Small spreading caliper.
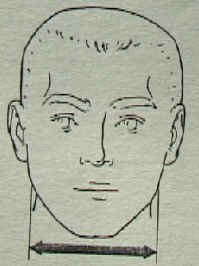
2. JAW- Bigonial diameter. The maximum breadth of the jaw across the gonial angles. Small spreading caliper.
3. ELBOW - Maximum breadth across the medial and lateral epicondyles of the humerus. Small sliding caliper.
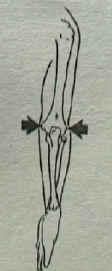
4. WRIST - Maximum breadth across the radial and ulnar styloid prominences of the wrist. Small sliding caliper.
5. BIACROMIAL DIAMETER - Shoulder Breadth. Maximum breadth across the most protruding points of the acromion processes. Shoulders in relaxed position. Large spreading caliper.
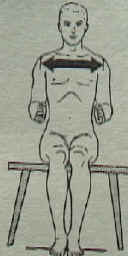
6. CHEST BREADTH - Maximum breadth across the rib cage in rest position at the level of the fifth rib. In the male this is at about nipple level. Large spreading caliper.
7. CHEST DEPTH - Maximum antero-posterior diameter of rib cage at rest at about level of fifth rib. In males this is about nipple level. Measurement taken from sternum to spinal column at right angles to slant of rib cage. Large spreading caliper.
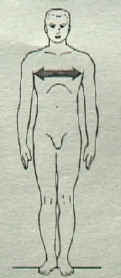
8. BIILIAC DIAMETER - Maximum breadth across the iliac crests of the pelvis. Large spreading caliper.
9. BITROCHANTERIC DIAMETER - Maximum breadth across the lateral trochanteric prominences of the femora. Large spreading caliper.
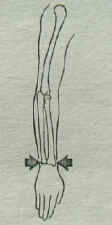
10. KNEE BREADTH - Maximum femoral bicondylar breadth of the knee. Small spreading caliper.
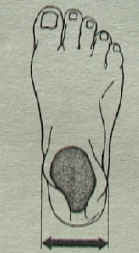
11. ANKLE BREADTH - Maximum, bimalleolar breadth of the ankle at right angles to the long axis of the foot. Small sliding caliper.
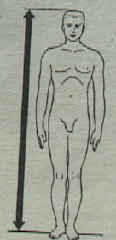
12. STATURE - Maximum ground-vertex distance. Subject standing as erect as possible with head oriented in the Frankfort or eye-ear plane. Anthropometer.
13. WEIGHT.- Pounds or Kilograms. Whenever possible weights are taken on a balance-beam type of scale, otherwise a spring type bathroom scale is used. Scales should be checked periodically for accuracy.
Additional Measurements Recommended
In addition to the measurements used in the Structural Profile we take several other measurements on each subject in order to describe more fully the physical structure. These dimensions are used primarily in the calculation of what we have termed the Shape Index which is the skeletal correlate of Sheldon's Trunk Index. The Shape Index is explained in the Discussion.
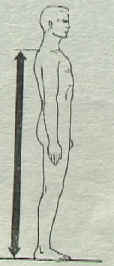
1. CERVICALE HEIGHT - Vertical distance from standing surface to the protrusion of the spinous process of the 7th cervical vertebra. Anthropometer.
2. ILIAC CREST HEIGHT - Vertical distance from standing surface to the top of the iliac crest in the mid-axillary line. It is recommended that this measurement be taken on both sides and,if there is a difference, record the average of the right and left measurements. Anthropometer.
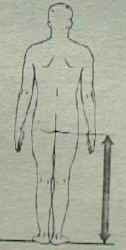
3. GLUTEAL FURROW HEIGHT - Vertical distance from the standing surface to the furrow where the gluteal curve intersects the back of the thigh. It is recommended that this measurement be taken on both sides and,if there is a difference., record the average of the right and left measurements. Anthropometer.
We are interested in skeletal size and consequently must rely upon instruments which can be applied as close to the prescribed skeletal landmarks as possible. For this reason, in taking transverse trunk measurements we use the large spreading caliper -- never the sliding caliper. The flat edges of the broken anthropometer do not compress the flesh sufficiently, and on even moderately obese subjects it is impossible to get close to bony points such as the iliac crests and the trochanters. In the chest area the sliding arms of the broken anthropometer measure not only the size of the rib cage but also inevitably include in this diameter varying amounts of fat, muscle, and flare of the scapulae. In females, the degree of breast development adds to the difficulty of obtaining an accurate measurement of the A-P dimension of the rib cage. With the large spreading caliper, we are able to obtain measurements closer to the rib cage in both breadth and depth dimensions in each sex. Naturally, our trunk measurements taken for the Structural Profile will not be comparable to those using the broken anthropometer or other straight edged, sliding arm calipers.
In comparing individuals or groups of individuals it is rather meaningless to rely solely on raw measurements. It is obvious that big people have larger dimensions than small people. We expect most Pygmy body measurements, for example, to be smaller than those of the Tutsi. Generally, proportion tells us more of the nature of body structure than raw measurement alone. Hence it is more significant to evaluate the various segments of the body relative to the size of the person before attempting to compare his physique to that of another person. For this reason, we calculate as proportions to stature all measurements used in these studies, thus eliminating the size factor. This constitutes the next step in the development of a Structural Profile.
During the first few years our Profile studies were based on data collected in the United States. We first gathered measurements on American college students to use as a control series for other studies. The male sample comprised 1179 Caucasian college men age 18-22 years and the female sample 687 Caucasian women of similar age, all largely from the Middle West. We converted all their to mean measurement/stature ratios and these ratios became our frame of reference for all our subsequent studies.
In order to see more clearly the differences in physique of our various groups or individuals as revealed by our measurement/stature ratios, we devised a chart on which to convert the data to graphic form, using, as stated, our American college sample as the standard of reference - indicated on the graph by the Mean or 100% line. ( See Figure 1. )
To complete a Structural Profile we calculate the percent variation of each of the eleven measurement/stature ratios from the corresponding mean ratios of the control series appropriate to the sex. Next, on a prepared graph, we plot these percentages in pairs, each representing one of the five major body segments: head, upper extremities, upper trunk, lower trunk, and lower extremities, in that order. Each pair of plots is then connected by a line and the mid-points of each of these five lines representing the five body areas is joined by a continuous line to form a visual sequential representation of the structural characteristics of an individual or a group. The line, which is curved in the graph solely for appearance sake, actually procedes successively from mid-point to mid-point of the five area plots.
The measurement/stature ratios of a given individual or group as noted above are calculated as percentages of the control means. This may be accomplished by dividing each measurement/stature ratio by the corresponding ratio derived from the control ( or mean ) series. A simpler method is to multiply each measurement/stature ratio by the reciprocal of the corresponding ratio from the mean series. These reciprocal values we have termed Multipliers.
The reciprocals of the measurement/stature ratios ( Multipliers ) for our male and female control series are given in Table 1. Included also in this table are the Multipliers for stature in inches and centimeters, weight in pounds and kilograms and reciprocals of ponderal index (height over the cube root of weight) based on stature in inches or millimeters and weight in pounds or kilograms.
Table
1
Additional Multipliers
|
Below are examples of how we use the Multiplier in arriving at the percentage deviation of various measurements and measurement/stature ratios from the mean or 100 percent value.
Example 1.
Face (Bizygomatic diameter) = 145 mm.
Stature = 1681 mm.
Face/Stature = 145 / 1681 x 100 = 8.626
8.626 x 12.86 = 110.9%
The Face/Stature ratio in this case is 10.9 percent above the mean or 100% value.
Example 2a.
Stature (in inches) = 69.5 inches
69.5 x 1.429 = 99.3%
The Stature in this case is 0.7% below the mean or 100% value.
Example 2b.
Stature (in millimeters) = 1812 mm.
1812 x .0563 = 102%
The Stature in this case is 2.0% above the mean or 100% value.
An example of how we arrive at a Sturctural Profile is given below. Table 2 presents the
measurements, measurement/stature ratios, multipliers and percentage deviation from the
average for a particular young adult, white male.
Table 2
Calculations for a Structural Profile
Subject A - Age 20 Years
|
The measurements in millimeters are divided by stature, also in millimeters, to form
ratios. These ratios in turn are multiplied by their corresponding Multipliers. The
resulting figures represent the percentage values of the measurement/stature ratios in
terms of the control series averages, designated as 100 percent. In the example given, the
face/stature ratio relative to the average is 102.6%. or 2.6% above the average value of
100.0%; the elbow/stature ratio is 97.1% of the average value of 100.0%. or 2.9% below the
average, and so on. The plotted deviations from the average of the individual's or group's
measurement/stature ratios indicate the physical characteristics as revealed by the series
of measurements taken, and this we call the Structural Profile.
A plotting of the percent values from Table 2 is graphically presented in Figure 1. From this Structural Profile we see that this young man possesses a broader face and jaw relative to stature as compared to the average. His elbows, on the other hand, and particularly his wrists, are relatively small. He has comparatively narrow shoulders but his chest breadth relative to stature is about average. His lower trunk diameters ( biiliac and bitrochanteric ) and his knees and ankles in proportion to his stature are all somewhat above average. He is almost one percent taller and 2.2 percent lighter in weight than the average young adult-American male. His ponderal index is at 98.2 percent of average. The average percentage value for all eleven measurements is 99.9%.
We would visualize this young man as being of average size with a largish face and well defined but not overly large jaw. At first glance he would appear rather more linear than he actually is because of his narrow shoulders and some delicate arms, especially forearms. His chest will look average but from the waist down he will look more sturdy though a little broad in the hips in relation to his rather narrow shoulders, and hence a little gynic. His legs will look fairly sturdy, furnishing the appearance of good support.
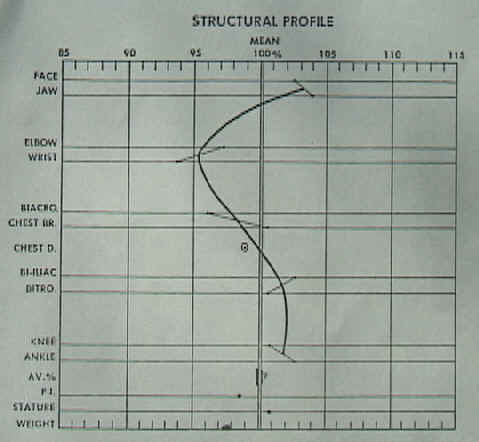
Figure 1
Fig. 1. Structural Profile of Subject A. White American male. Age 19 years. Height 70.6. Weight 156 pounds. Ponderal Index 13.12. Plotted Reciprocal P.I. 7.62. To construct this young man's Structural Profile we have plotted his 11 measurement/stature ratios in terms of % deviations from our standard (the 100% line) based on a sample of 1179 American college males.
Another example of an individual structural profile is shown in Figure 2 (Subject B). Here we see that all the measurement/stature ratios are well above average and there is very little variation throughout the pattern as a whole. The lower trunk area, however, is relatively more slender compared to the upper trunk, but this is a masculine characteristic and is commonly found in mesomorphic physiques relatively low in endomorphy. The average percentage value for the eleven ratios is 105.2%. At 66.3 inches this man's stature is only 94.5% of average and his weight of 141 pounds is at 88% of average. In terms of height-weight ratio or ponderal index, however, he falls slightly more than 1% above average.
We can visualize Subject B as a short man, not heavy but sturdily built with a big strong looking face and large strong arms, broad shouldered though surprisingly a little narrow across the chest. This would not be immediately obvious, for his trunk as a whole and his legs will appear proportional in strength to his physique as a whole.
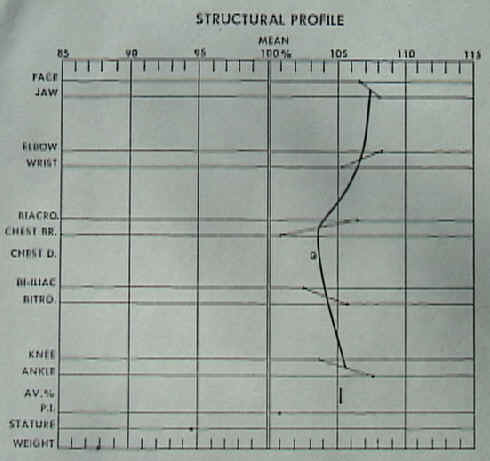
Figure 2
Fig. 2. Structural Profile of Subject B. White American male medical student. Age 25 years. Height 66.3 inches. Weight 141 pounds. Ponderal Index 12.74. Plotted Reciprocal P.I. 7.85. Although this young man is over 5% shorter than the average for our white American college male sample, his skeletal measurement /stature ratios average 5% greater.
APPLICATIONS
During the past few years we have taken anthropometric measurements and plotted the Structural Profiles on many individuals and groups of people throughout the world. In this paper we are presenting a few examples of the application of the Structural Profile.
Racial Groups
The procedure for arriving at the Structural Profile for a group of individuals is exactly the same. as for a single person. For example, we have plotted in Figures 3 to 7 the average Structural Profiles of a large series of Japanese, Indian, and West African ( Ivory Coast ) young adults both male and female, of similar age and drawn from school populations. Figure 3 shows the Structural Profile of a group of 334 Japanese young men, mostly university students, representing a wide variety of disciplines, plotted against the mean values of our control group of young American college men. From this graph, as expected, the Japanese young men show the Mongoloid racial characteristic of relatively very large, broad faces when compared with our American sample who were all Caucasians. Although their elbows are slightly smaller, their wrists are larger than the Americans, both measurements relative to stature. The Japanese' shoulders are considerably broader than the Americans, as is the bitrochanteric diameter, but their relative chest breadth and biiliac diameter are nearly the same. In the lower extremities the Japanese young men have much larger knee and ankle diameters relative to stature than do the Americans. Also in proportion to height their average chest depth is considerably more shallow than in Americans. Although the average ponderal indices for the two compared groups are almost identical, the Japanese mean stature of 66.0 inches is only 94.3% of the American mean, and the Japanese mean weight of 135.6 pounds is only 84.8% of the American mean. An overall picture of our Japanese sample indicates in relation to our American group, on the average, a large faced, broad shouldered, sturdy physique, with strong arms and powerful legs.
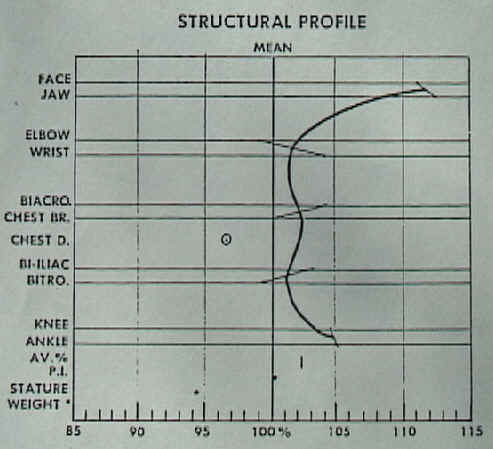
Figure 3
Fig. 3. Average Structural Profile of 334 Japanese college males. Japanese males average: age 21 years, height 66.0 inches, weight 136.6 pounds, ponderal index 12.86, and reciprocal P.I. 7.77. The means for all our Structural Profiles in this study are based on our American male or female control series. This graph illustrates the percent deviations of the measurement/stature ratios of Japanese students plotted against the American male mean ratios. In almost every ratio the Japanese are proportionately larger than the Americans.
We should point our here that these 334 Japanese subjects comprised six samples measured in three different localities - Tokyo and Nagoya in Honshu, and Kumamoto in the southern island of Kyushu. They were variously studied in 1968) 1970 and.1973. It is interesting to note that the Structural Profile plottings for these six different subgroups are almost identical. This suggests that Japanese males appear to be remarkably homogeneous so far as physical endowment is concerned. These findings seem to concur with Krause's ('51) conclusions that there is an unusually small range of somatotypes to be found among Japanese males.
It is of some interest that the Structural Profile presented in Figure 4 showing Japanese young adult females plotted against the American female mean (Figure 4 ) resembles in contour the male Japanese Profile in Figure 3. This suggests that Japanese females differ structurally from American females in much the same pattern that Japanese males differ from American males. A major difference, however, is in the upper trunk- lower trunk relationship. Among, the Japanese males the average of the deviations of the two upper trunk ratios ( biacromial and chest breadth ) are only slightly greater than those of the lower trunk ( biiliac and bitrochanteric ). Japanese females on the other hand show upper trunk ratios considerably larger than their American counterparts, but in the lower trunk the ratios for the Japanese women deviate scarcely at all from the American female means. Or, in other words, the Japanese females seem to be relatively narrow hipped as compared to American women.
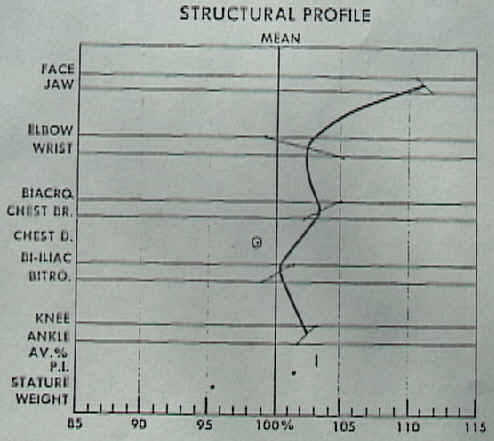
Figure 4
Fig. 4. Average Structural Profile of 35 young adult Japanese females. The Japanese women average: age 19 years, height 62.2 inches, weight 115 pounds, ponderal index 12.80, and plotted reciprocal P.I. 7.81. The means used for the female standard are based on a series of 687 white American college women. The Japanese female ratios differ from the American women's in a similar pattern to that of the Japanese males ratios compared to American males. The Japanese show a mesomorphic relationship of narrow lower trunk relative to upper trunk.
We should emphasize at this time that the choice of the American series as controls is, of course, purely arbitrary. Thus, if we reversed the American and Japanese means, using the Japanese averages as the standard, we would find the opposite picture: American young men and women, compared to Japanese possess relatively narrow faces, narrow shoulders, broader hips, and relatively smaller bone structure in the arms and legs.
As in the case of the Japanese our Indian sample was collected over a four year period from several different localities many hundreds of miles apart. We took Profile measurements on several groups of young Indian males totalling 160, principally university students, and measured in Chandigarh, capital of the Punjab, in Nagpur, Maharashtra, near the geographical center of India, and in Bangalore, Mysore State. Here again when we plotted the Profiles for these various subgroups comprising our over-all Indian male sample, we found those from Nagpur and Bangalore were almost superimposable and presented a distincly Indian Profile vastly different from any other racial or national group we have yet studied. Certain differences were found, however, among the series studied in Chandigarh in north India. This group was made up predominantly of Punjabi, who have always had the reputation for being bigger, stronger men and were noted as fierce fighters during the English occupation of India. Actually the principle differences in the Structural Profile for the Punjabi (Figure 5) were found in the trunk dimensions. This group possessed significantly broader biacromial, biiliac, and bitrochanteric diameters relative to stature compared to the other Indian subsamples from Nagpur and Bangalore, although they still showed the general Indian characteristic of relatively small structure in the arms and chest. The Punjabi also averaged -about two inches taller and about sixteen pounds heavier than the groups from central and southern India.
In general the Structural Profiles of the various Indian series indicate relatively broad facial dimensions, relatively smaller arm and leg joint sizes, and small chest and lower trunk breadths (except for the Punjabi) as compared to the young adult men.
The average stature for the combined Nagpur and Bangalore series is 65.3 inches or 93.3 percent of the American mean, and their weight is 115.7 pounds or 72.4 percent of the American mean. The corresponding figures for the Punjabi are: stature 67.2 inches (96.1 percent) and weight 134.9 pounds (84.3 percent).
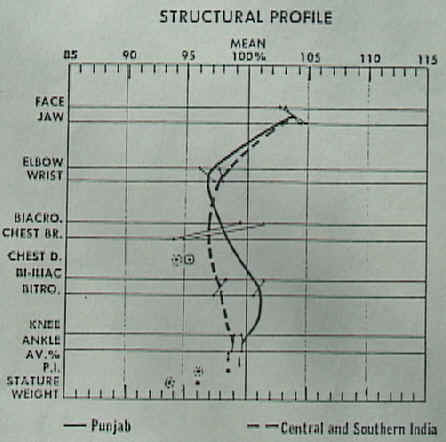
Figure 5
Fig. 5. Average Structural Profile of 2 Indian male groups. The solid line represents the average Profile of 45 Punjabi ( Chandigarh ) whose averages are: age 28, height 67.2, weight 134.9 pounds, ponderal index 13.11 and reciprocal P.I. 7.63. The broken line represents 115 Indians from central and southern India ( Nagpur and Bangalore ). Their averages are: age 25, height 65.3, weight 115.7 pounds, ponderal index 13.42, and reciprocal P.I. 7.45. The Punjabi Profile indicates that their shoulders and lower trunk are broader in comparison to our sample of central and southern Indians. The relatively slender arm and leg structure and narrow chest are characteristic of all three area groups.
Another interesting comparison is shown in Figure 6. Here we have the average Structural Profile of 144 young adult West African males from the Ivory Coast (Cotes d'Ivoire) drawn from school populations of college and lycee levels of education, plus a few university students, all of about the same age range as our other samples. The students were studied in Abidjan, the capital, and Katiola, a town of 12,000 population 250 miles north of Abidjan. Government policy is to mix students from many different geographic areas., and so although we worked in only two different places, our sample includes representatives from many different ethnic (tribal) groups with little emphasis on any particular group.
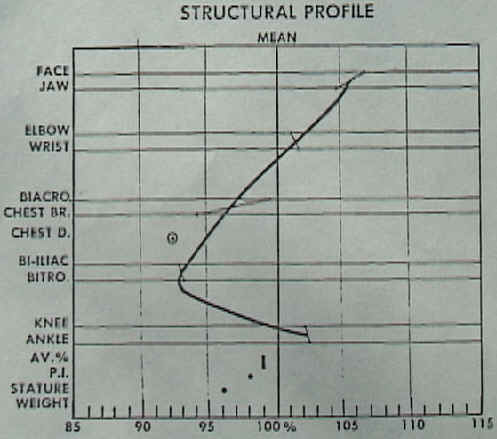
Figure 6
Fig. 6. Average Structural Profile of 144 young African men drawn from school populations in the Ivory Coast. They average: age 19.6, height 67.1 inches, weight 133.6 pounds, ponderal index 13.15, and reciprocal P.I. 7.61. Their Profile indicates a very masculine configuration with relatively broad shoulders and very narrow hips.
This series is also plotted against the American mean values. The Ivoirians possess relatively broader facial structure as compared to the Americans. Relative to stature their arm and leg measurements are also bigger than in the American males. However, the Ivoirians have narrow chest diameters ( both lateral and anterposterior ) and very narrow pelvic structure as revealed by both the biiliac and bitrochanteric diameters in proportion to stature when compared to the Americans Their configuration of broad shoulders and narrow hips is highly masculine and a mesomorphic characteristic. The Ivoirians' average stature of 67.1 inches is about 96 percent of that of the Americans. Their average of 133.6 pounds is only 83.5 percent of the American mean weight. The Ivoirian weight/stature ratio is 98 percent of the American mean value.
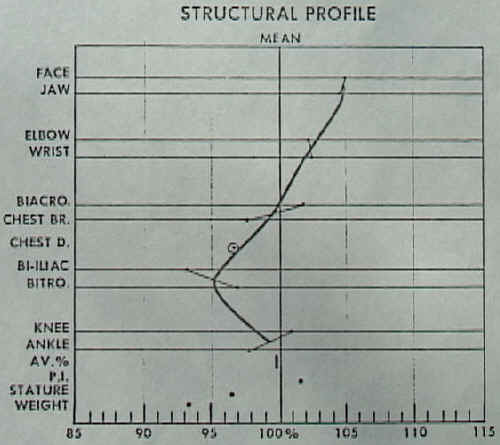
Figure 7
Fig. 7. Average Structural Profile of 113 Ivory Coast young women from a school population. Their averages are: age 19, height 62.8 inches, weight 117.7 pound ponderal index 12.84, and reciprocal P.I. 7.79. The contour of these West African women's Profile differs from that of the American women in a similar way to that of our West African male sample from the Ivory Coast in comparison to our American male control series.
In like manner to the Japanese, the Structural Profile of Ivoirian females (Figure 7) based on American female means is remarkably similar in contour to that which was found for the males. Compared to the American young women the Africans possess relatively broader faces, larger arm dimensions., narrower and shallower chests, much narrower lower trunks and somewhat smaller ankles. The Ivory Coast girls average 3.5 percent shorter and almost 7 percent lighter in weight than their American counterparts.
Athletes
It is a generally accepted notion that physical endowment is one of the important factors contributing to success in various forms of athletics. In the study of physiques of athletes we have perhaps some of the more clearcut examples of how form and function are interdependent. Certain bodily performance is limited by the form of the structure of the performer. As Tanner ('64) pointed out "there are marked differences in somatotype distribution between competitors in different events." Sprinters are relatively short and very muscular men in contrast to the more lightly built long distance runners. High jumpers are tall and relatively long legged shot putters are large, muscular men.
We have made studies of the physical endowment of many different kinds of athletes. The Structural Profile derived from their measurement/stature ratios provides us with a clear indication of the relationship between form and function. We have chosen football to demonstrate two contrasting physiques ass related to performance.
American football in its present highly structured form demands a variety of physical types to perform various game functions. We have selected players of two different positions, linesmen and defensive backs, to show obvious physical differences of these two groups as demonstrated by the Structural Profile. The duties of the linesmen require massive, powerful physiques; defensive backs must be agile, fast, but still rugged. Figures 8 and 9 show the average Structural Profiles for a series of 12 professional football linesmen and 8 defensive backs. The linesmen average 74.8 inches in height or 9.3 percent above our control mean value. Their average stripped weight is 255 pounds, 59 percent above the control mean of 160 pounds for our adult male college series. Their average weight/stature ratio ( ponderal index ) is nearly 6 percent above the mean. Not only are they tall, but their skeletal structure is massive even in relation to their great height. Our linesmen possess both relatively and absolutely large trunks and heavy elbow, wrist, knee, and ankle joints. They have exceptionally deep chests and their mean chest/stature ratio is 18 percent above the average.
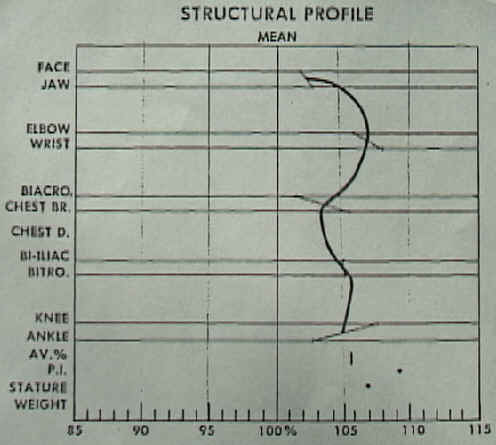
Figure 8
Fig. 8. Average Structural Profile of 12 professional football linesmen. They average: age 25, height 74.8 inches, weight 255 pounds, ponderal index 11.79, and reciprocal P.I. 8.48. The percentage deviation for weight (159%) and chest depth (118.6%) are too great to be plotted on the graph.
The profile for the defensive backs is quite different ( Figure 9). Here we see that these players, while above the mean in head, arm, and leg structure, are just about average in the trunk. Their shoulder and biiliac ratios fall a little below average, but their chest breadth and bitrochanteric ratios are both a little on the plus side of average. While their offensive, grasping equipment ( arms ) and their supportive and locomotive equipment (legs) appear to be of necessity sturdier for the job required, the relatively lighter trunk probably aids their speed and agility.
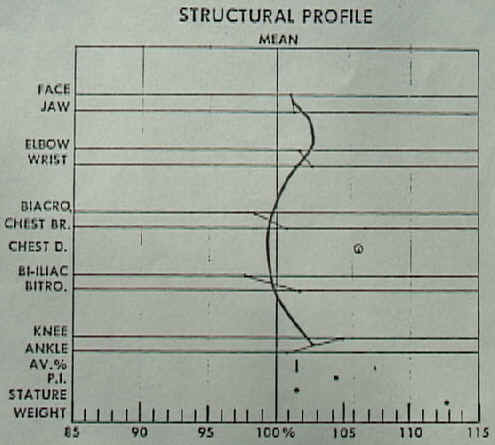
Figure 9
Fig. 9. Average Structural Profile of 8 professional football defensive backs. Their averages are: age 25, height 71.1 inches, weight 190 pounds, ponderal index 12.36, and reciprocal P.I. 8.09. The Profile of the Backs indicates a much less massive skeletal structure than that of the football Linesmen.
DISCUSSION
Choice of Measurements for the Structural Profile
The choice of skeletal measurements to represent different parts of the body was not difficult but indeed was generally rather obvious. Desiring for simplicity's sake to keep the total number of measurements to a minimum., we limited the number to two for each of five body areas. We chose for the Profile only lateral measurements in order to eliminate the introduction of another dimension. Chest depth and the vertical measurements used to calculate the Shape Index told us about other bodily proportions, but incorporating these into the Profile would only have introduced a degree of complexity that would be difficult to deal with statistically and graphically.
We chose facial dimensions rather than cranial dimensions because we felt the face was the most important part of the head to describe. The bizygomatic and bigomial diameters seemed the most useful measurements to describe the face. They also corresponded skeletally to the FB 1 and FB 2 measurements which Sheldon originally took on the somatotype photograph in an effort to discriminate more objectively between the three somatotype components in this area. People tend to form their judgement of others by observing the face rather than the skull. The face is observed more closely than any other part of the body on first meeting, and initial judgements are immediately if unconsciously, formed by facial construction. It is perhaps not without meaning that people with prominent jaws wide bigomial diameter in relation to bizygomatic ) and weak or narrow jaws reverse relationship are assigned certain character traits, particularly of aggression or passivity, strength or weakness. The reasons may be obscure and not easily substantiated but references to these facial characteristics abound in literature.
The four trunk measurements are classic anthropometric dimensions and the obvious ones to choose for our purposes. Biacromial diameter - shoulder breadth - we associate with degrees of general bodily sturdiness. Broad shoulders imply strength and masculinity, narrow shoulders suggest weakness and femininity. Broad and narrow chests bear similar connotations. Breadth of lower trunk., especially in relation to upper trunk, is closely associated with the androgenous mosaic. As used in calculating the Shape Index, it also is an important determinant of degrees of endomorphy and mesomorphy.
The choice of the four joint measurements in the extremities had to be made as they are the only places where one can get close to the bone. Hand and foot breadths are to a degree affected by use and more difficult to measure accurately. But the joints themselves are a very important part of total body performance. It is generally considered that there is some correlation between size of muscle and size of joint. Furthermore, the joints are the moveable parts of the fighting/defending and supportive/fleeing/pursuing equipment. While relative shaft lengths cannot be ignored, the joints themselves are the working, moving parts. In machines it is the moving parts that wear out and break down under stress, and they must be designed proportional to the work involved. And just as the heaviness of the shaft is designed in relation to the size of the gear, joint, or other point of friction, so the thickness of the shaft certainly must bear a close relationship to the size of the joint. If we measure a large joint, then we may make a fairly accurate assumption that the shaft will be proportionately strong (thick ). Shaft thickness, of course can only be measured in the x-ray, which, while possible, is difficult and costly to obtain.
We often take other measurements in addition to those needed for the Structural Profile and the Shape Index, the type taken depending on the nature of the study. In the racial studies for instance, we have added other face and head measurements. We have not as yet incorporated any of them into the Profile.
Calculation of the Shape Index
In 1971 Sheldon described what he called the "Final Objectification of Somatotyping". In that discussion he presented for the first time in published form a description of the Trunk Index or the area of the thoracic trunk divided by the area of the abdominal trunk as measured by a planimeter on standard somatotype photographs. For somatotyping purposes the Trunk Index became a dependable parameter for differentiating quantitatively between the first two components of the somatotype, endomorphy and mesomorphy. It also appeared to be constant throughout life and completely independent of nutrition. If this be true ( and many years of utilizing the Trunk Index in somatotyping convinced us that it is ), it can be inferred that the upper trunk - lower trunk relationships of the underlying skeletal structure should also be constant and could also be accepted as a basic parameter for differentiating between the first two components of the somatotype. Following this reasoning we chose a series of measurements with which to calculate the skeletal equivalent of the Trunk Index.
The four transverse anthropometric measurements which we take on the trunk plus cervicale, iliac crest, and gluteal furrow heights provided the basis for delineating the upper and lower trunk areas which correspond to the areas which are planimetered on the photographs. This resulting skeletal index we named Shape Index.
The area of the upper trunk is calculated from the measure of its length multiplied by two measures of its breadth. Upper trunk length is simply cervicale height minus iliac crest height and the measure I of upper trunk breadth is furnished by biacromial diameter plus chest breadth. Similarly lower trunk length is iliac crest height minus gluteal furrow height and lower trunk breadth is approximated by the two measurements biiliac and bitrochanteric diameters.
The formula for calculating "Shape
Index" (SI), corresponding to Sheldon's Trunk Index (TI), is as follows:
SIB X 85.5 (for males) or X 78.0 (for females) = SIA (Shape
Index-Area) |
The multiplication by the factors 85.5 for males and 78.0 for females is necessitated by
the fact that in an experimental series of several hundred subjects it was found that the
TI derived from the planimeter measurements on the photographs was consistently smaller
than the SIB calculated from the bone measurements. For males the TI planimeter averaged
about 85 percent of the SIB and for females the difference was 78 percent.
The SIA (area) then corresponds to Sheldon's TI. In several experimental series we have found that the SIA calculated from the skeletal measurements correlates very highly with the TI derived from planimeter measurements taken on somatotype photographs. In nearly every instance the SIA is found to vary at most not more than �.10 of the TI value. Anything beyond this range suggests mistakes in measuring or recording and indicates checking data.
Since the SIA ordinarily corresponds so closely with the TI, it provides a ready tool for estimating the strengths of the endomorphic and mesomorphic componets of the somatotype. In cases where it is impossible to take somatotype photographs, the SIA derived from the measurements, plus stature (for the third component), and ponderal index gives us a reasonably good estimate of the somatotype based on Sheldon's most recent somatotyping tables.
Somatotype and Structural Profile
We have not as yet attempted to relate somatotype with the Structural Profile except in a general way. Each component has its influence on relative size of bone structure, or rather, the rating of each component is influenced by skeletal size and proportion. By definition, ectomorphs have more delicate and attenuated skeletal structure., so it would seem logical to expect that most of the measurement/stature ratios of dominant ectomorphs would lie to the left of the Mean on the graph. The actual position of the plots on the graph would of course be affected by the amount of both endomorphy and mesomorphy present in the various areas of the physique). Similarly we would expect the measurement/stature ratios of dominant endomorphs and mesomorphs generally to lie above the Mean ( percentages above 100% ).
To test this theory we gathered together 10 examples of extreme endomorphs, 10 extreme mesomorphs, and 10 extreme ectomorphs, all males. The average component ratings for the endomorphs was 7 3 1.5, for the mesomorphs 4 7 1.5 , and for the ectomorphs 2 2 7.5. It should be mentioned that the mesomorphs were all competitors in the heavyweight division of the international weight lifting competitions. The endomorphs and ectomorphs were culled from various series which we had studied over the years.
Figure 10 shows the average Structural Profile for these three groups of somatotype extremes. In each case we have plotted the measurement/stature ratio deviations of the three groups of extreme somatotypes against our male control series. Table 3 presents the age, height, and weight data for the three groups.
Table
3
|
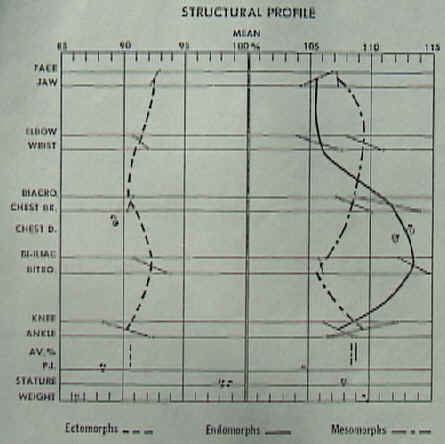
Figure 10
Fig. 10. Average Structural Profiles of 3 male extreme somatotypes plotted against the average for our white American college male control series. Profiled are: 10 extreme endomorphs whose average somatotype is 7-3-1 1/2 and average: age 20, height 68.5 inches, weight 247 pounds, ponderal index 10.94, and reciprocal P.I. 9.14; 10 extreme mosomorphs whose averages are: somatotype 4-7-1 1/2, age 29, height 70.2 inches, weight 226 pounds, ponderal index 11.58, and reciprocal P.I. 8.64; 10 extreme ectomorphs whose averages are: somatotype 2 1/2-2-7, height 75.3 inches, weight 138 pounds, ponderal index 14.57, and reciprocal P.I. 6.86. The mean percent deviation for the endomorphs weight (171%) and their P.I. (118%) are too extreme to show on our graph.
Figure 10 shows that the measurement/stature ratios for both the endomorphs and mesomorphs are all far above the Mean or 100 percent line. In fact the average for all eleven ratio deviations for both series is about 9.0 percent above the Mean. There are certain differences, however, in the Profiles for the two groups. The mesomorphs show relatively larger bone structure than the endomorphs in the head, arms, and legs. They also show the characteristic mesomorphic relationship of larger upper trunk dimensions relative to the lower trunk. This configuration is usually associated with the concept of the typical masculine physique.
The extreme endomorphs also possess large skeletal dimensions relative to stature but the pattern is different from that of the mesomorphs. Extreme endomorphs have relatively smaller head, arm, and leg dimensions than the extreme mesomorphs, but their chests and lower trunks are very much broader. Characteristically, the lower trunk measurement/stature ratios are considerably larger than those of the upper trunk. This is just the opposite of the situation found for the mesomorphs and seems to follow the female pattern in this respect.
Although the Profile for the extreme ectomorphs shows their measurement/ stature ratios all considerably below the control Mean value of 100 percent, and indicates relatively little variation from head to foot, it is interesting to note the difference in the ratio plottings for the lower trunk as compared to those for the upper trunk. The relatively higher bitrochanteric/stature ratio suggests a slight tendency towards endomorphy in this group, and indeed the average endomorphy is 2 1/2 as compared to 2 for mean mesomorphy.
In general it has been our experience that when the measurement/stature ratio deviations for the lower trunk are at higher percentage values on the chart as compared to those for the upper trunk, it is an indication of relatively higher endomorphy as compared to mesomorphy. This seems to be true not only for individuals but for groups as well. The reverse seems also to be true. Generally speaking relatively higher percentage values for the upper trunk plots in the Structural Profile, as compared to those for the lower trunk, generally suggests a predominance of mesomorphy over endomorphy.
These findings based on skeletal measurements alone seem to corroborate Sheldon's original differentiations between endomorphy and mesomorphy based. on observational criteria from the somatotype photographs. When we compare our Structural Profile data with the somatotype photographs of the same subjects, we can readily observe that our skeletal measurements do indeed coincide with our visual judgement of this aspect of the physique.
Further evidence to show that our skeletal measurement data supports the observational criteria for differentiating between the first two components of the somatotype, endomorphy and mesomorphy, is indicated in the Shape Index.
Males Versus Females
There are certain structural characteristics that are generally considered to be associated with the male or the female form. With this in mind we thought it would be interesting to compare the Structural Profiles of our male and female control series, each in terms of the other. While this may not contribute any startling new information about sex differences, it does demonstrate those differences rather dramatically in the graph.
Figure 12
Fig. 12. Female Structural Profile using the male Means and male Structural Profile based on female Means.
In Figure 12 we have plotted the Structural Profiles of our average American young adult female against the norms for the young adult American male and vice versa. In other words we have multiplied the female measurement/stature ratios by the male Multipliers to indicate the percent deviation of the females from the male Means. In like manner the female Multipliers were applied to the male measurement/stature ratios to indicate the male percent deviation from the female norms. Naturally the male profile ( unbroken line) is the mirror image of the female profile (dotted line) since we are using the same figures to arrive at the percentage values.
The profiles in Figure 12 show that in proportion to stature males have by comparison relatively narrower faces and wider jaws than females. Also the males have very much bigger arm and upper trunk dimensions relative to stature compared to the females. Similarly their hip dimensions in proportion to stature are decidedly smaller than in the females. Finally the male leg/stature ratios are considerably larger when compared to the females. Interestingly enough we find almost exactly the same picture when we compare male and female Structural Profiles among other racial groups such as the Japanese, Indians, and Africans. The only differences are in degree, not in the general picture.
Racial Studies
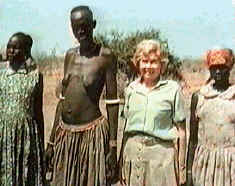
It is impossible in this paper to present Structural Profiles of all the various racial groups we have studied in the Orient, Africa, and Europe. From a study of these Profiles, however, we find strong indications that they may constitute reliable criteria in differentiating between various racial and ethnic groups in terms of the total physique instead of relying primarily on head measurements, as has often been the custom in the past. For example, as mentioned earlier, the Profiles of the several series that constitute our Japanese sample are nearly superimposable, and they are distinct in pattern from those of every other racial group. The same can be said after comparing several Chinese series which we studied in Taiwan and Hong Kong. Each of these Chinese series exhibited a Structural Profile that was characteristic for Chinese and quite different from that of any other racial group we have measured. In like manner, the several series of Bantu we have studied in Southern and Eastern Africa., as well as our non-Bantu ( Ivoirian ) West Africans, all resemble each other in their Structural Profile patterns, and these patterns are distinct in contour from either our American or Asiatic series. Although there is some variation to be found in the Structural Profiles for different tribal groups, there is still a strong resemblance in their general patterns which seems to be distinctive for these types of native Africans. We have also constructed Profiles of Kalahari Bushmen and Ituri forest Pygmies from our measurements of these two primitive groups. It is interesting to note that the average Structural Profiles for these two series of small peoples show marked similarities to those of our Bantu and west African samples. On the other hand, average Profiles of Samburu ( a Masai tribe ) and Turkana ethnic groups, both Nilotic, of northern Kenya are quite distinctive but similar to each other. We hope to deal with this subject more fully in a later publication.
CONCLUDING REMARKS
In this paper we have not been concerned with comparing our anthropometric data with that collected by other investigators. We are simply presenting a new and objective method for evaluating differences in body structure for individuals or groups.
The Structural Profile which we have described can serve as a frame of reference for correlating physical characteristics with other aspects of total personality. The Structural Profile gives us at a glance an idea of over-all physical endowment based on skeletal structure, and also the relationships between the various segments of the body. It provides a measure of intersegmental asymmetry - a valuable adjunct to the concept of dysplasia, or bodily. disharmony.
The Structural Profile may be looked upon as a morphological fingerprint. Results of our investigations indicate that each individual's Structural Profile is unique; it is, as well, often found to be distinctive for particular groups of subjects such as ethnic, athletic or disease groups. Our studies in growth and development have shown there is remarkable consistency in the Profiles of children, at least from the age of 3 or 4 years onward. Even a cursory study of Tanner's ('55) superb, perfectly posed photographic series of emerging adolescents reveals the constancy of shape and proportion at this dramatic period in growth and development. Among adults the measurement /stature ratios which are the basis of the Structural Profile remain extraordinarily constant throughout life because they describe the skeletal form. The possible exceptions may be found in measures of the rib cage where the antero-posterior diameter and, to a lesser extent, the chest breadth tend to increase with advancing years or as a result of pathological pulmonary conditions. In older people, too, all the ratios used in the Structural Profile may become somewhat larger due to decrease in stature. Consequently in the later decades the various proportions will become more exagerated with loss of stature and increase in the size of the thoracic area but the general pattern of the Profile will remain virtually unchanged. We have been able to corroborate this observation upon the results of a Structural Profile study on a very large series of male patients (age range 40 - 70 years ) suffering from coronary heart disease.
The Structural Profile is a simple thing and yet yields a surprising amount of useful information. Collecting the measurements required to prepare the Profile is not difficult. No costly equipment is needed. One needs only an anthropometer and three standard calipers, a weighing scale, and, if desired, a skinfold caliper. If no photography is planned, only a small amount of space is needed. With the aid of a pocket electronic calculator and the list of Multipliers, it is possible to calculate the percentage values and plot them on the Profile graph almost as fast as the measurements are taken.
We hope that researchers in a variety of related fields may find the Structural Profile useful in studies where the understanding of human physical variation is involved.